EEG analysis note
  • 前言
  • Preprocessing notes
  • 有用的链接
  • 基线
  • 时间频率分析 基础
  • make waves
  • FFT
  • Matlab FFT ref
  • ERSP
  • FFT vs. Morlet
  • Pad ratio
  • 时频顺序
  • std_ersp还是newtimef
  • eeglab的PLOT
  • eeglab的统计模块
  • 小波
Powered by GitBook
On this page
  • Generate this curve within matlab using the following commands
  • Matlab’s FFT Command
  • A Custom Function for fft to Obtain only the Positive Frequencies

Was this helpful?

Matlab FFT ref

PreviousFFTNextERSP

Last updated 5 years ago

Was this helpful?

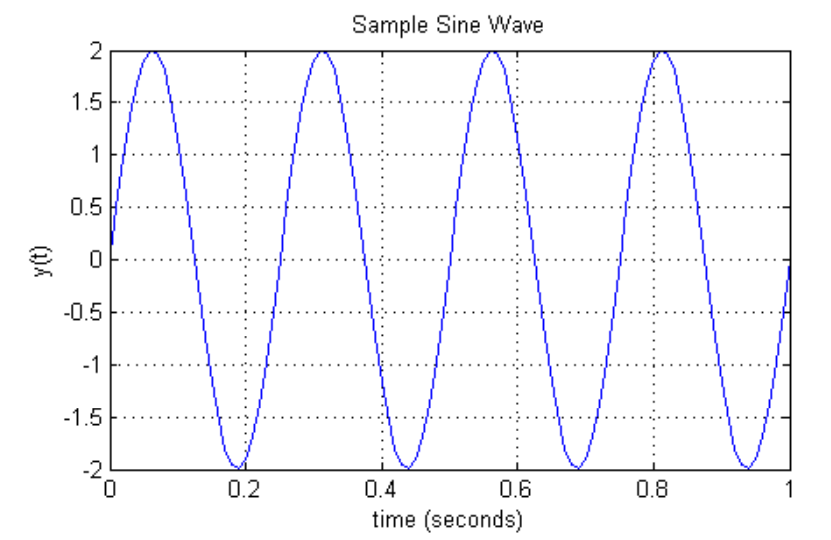
Generate this curve within matlab using the following commands

fo = 4; %frequency of the sine wave
Fs = 100; %sampling rate
Ts = 1/Fs; %sampling time interval
 t = 0:Ts:1-Ts; %sampling period
n = length(t); %number of samples
y = 2*sin(2*pi*fo*t); %the sine curve
%plot the cosine curve in the time domain
sinePlot = figure;
plot(t,y)
xlabel('time (seconds)')
ylabel('y(t)')
title('Sample Sine Wave')
grid
Matlab’s FFT Command
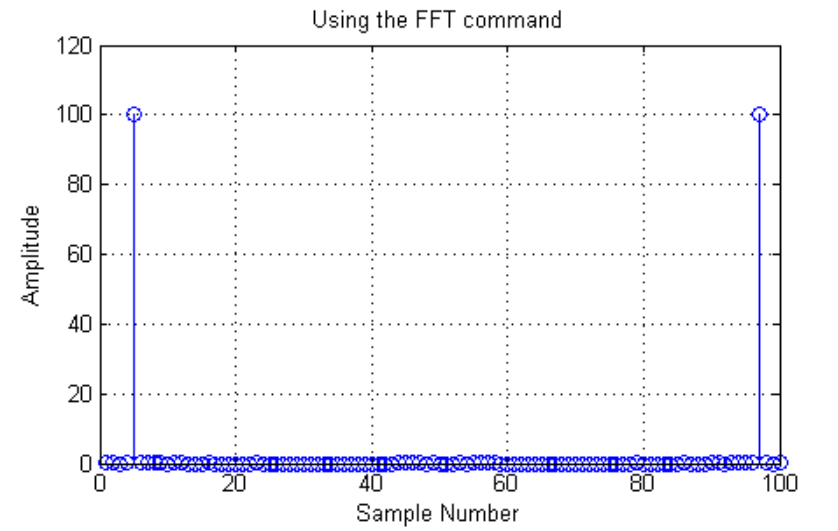
So now that we know what to expect, let’s use MATLAB’s built in fft command to try to recreate the frequency spectrum:

%plot the frequency spectrum using the MATLAB fft command
matlabFFT = figure; %create a new figure
YfreqDomain = fft(y); %take the fft of our sin wave, y(t)
stem(abs(YfreqDomain)); %use abs command to get the magnitude
%similary, we would use angle command to get the phase plot!
%we'll discuss phase in another post though!
xlabel('Sample Number')
ylabel('Amplitude')
title('Using the Matlab fft command')
grid
axis([0,100,0,120])
  • The x-axis gives us no information on the frequency.

  • The amplitude is all the way up to 100

  • The spectrum is not centered around zero

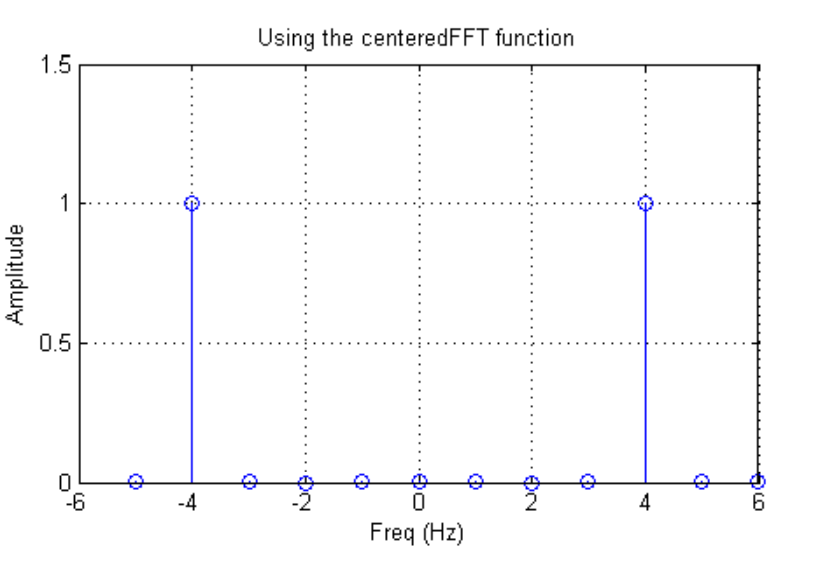
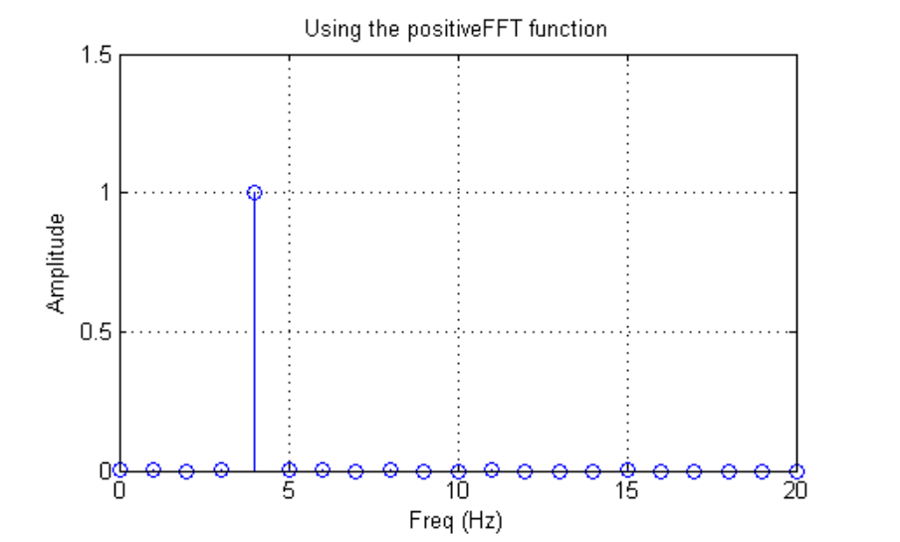
A Custom Function for fft to Obtain only the Positive Frequencies

function [X,freq]=positiveFFT(x,Fs)
N=length(x); %get the number of points
k=0:N-1; %create a vector from 0 to N-1
T=N/Fs; %get the frequency interval
freq=k/T; %create the frequency range
X=fft(x)/N; % normalize the data
%only want the first half of the FFT, since it is redundant
cutOff = ceil(N/2);
%take only the first half of the spectrum
X = X(1:cutOff);
freq = freq(1:cutOff); 
end
[YfreqDomain,frequencyRange] = positiveFFT(y,Fs);
positiveFFT = figure;
stem(frequencyRange,abs(YfreqDomain));
set(positiveFFT,'Position',[500,500,500,300])
xlabel('Freq (Hz)')
ylabel('Amplitude')
title('Using the positiveFFT function')
grid
axis([0,20,0,1.5])

原文